Billing issued history reports
In this article
Billing issued history reports
The billing issued history report in bilabl enables you to track and summarize revenue from all billings billed to clients over a specific period. This report helps you track revenue, compare it with budgeted revenue, and evaluate individual or team performance. You can customize it to focus on specific revenue categories like professional fees, disbursements, or taxes.
Before you begin:
- Revenue visibility: Each user can access the revenue data based on their user role:
- Admin, Manager, Accountant: Full access to revenue data for all clients.
- Team Leader: Limited revenue data for clients assigned to your team.
- User: Restricted revenue data for your assigned client.
- Revenue distribution: To accurately understand the report, know how revenue is distributed among users or teams, as multiple contributors may be involved in a single invoice. For details, refer to the “Revenue Distribution” section in the Matter User Guideline at: How the revenue is distributed.
Accessing the report
You can view the billing issued history reports in two ways: a detailed report or a summary widget on your dashboard.
Detailed report
To access the detailed version of the report, follow these steps:
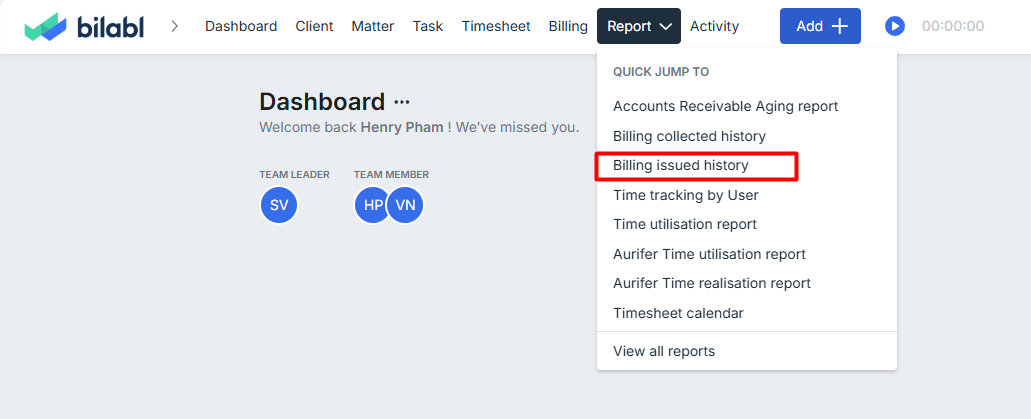
- Navigate to the Reports section.
- Locate and select the Billing issued history report.
Report widget (summary view)
To display the report on your dashboard:
- Follow the instructions in Manage Your Widgets to enable the billing collected history widget.
- Once added, the summary will appear directly on your dashboard.
Understanding report sections
Trending chart
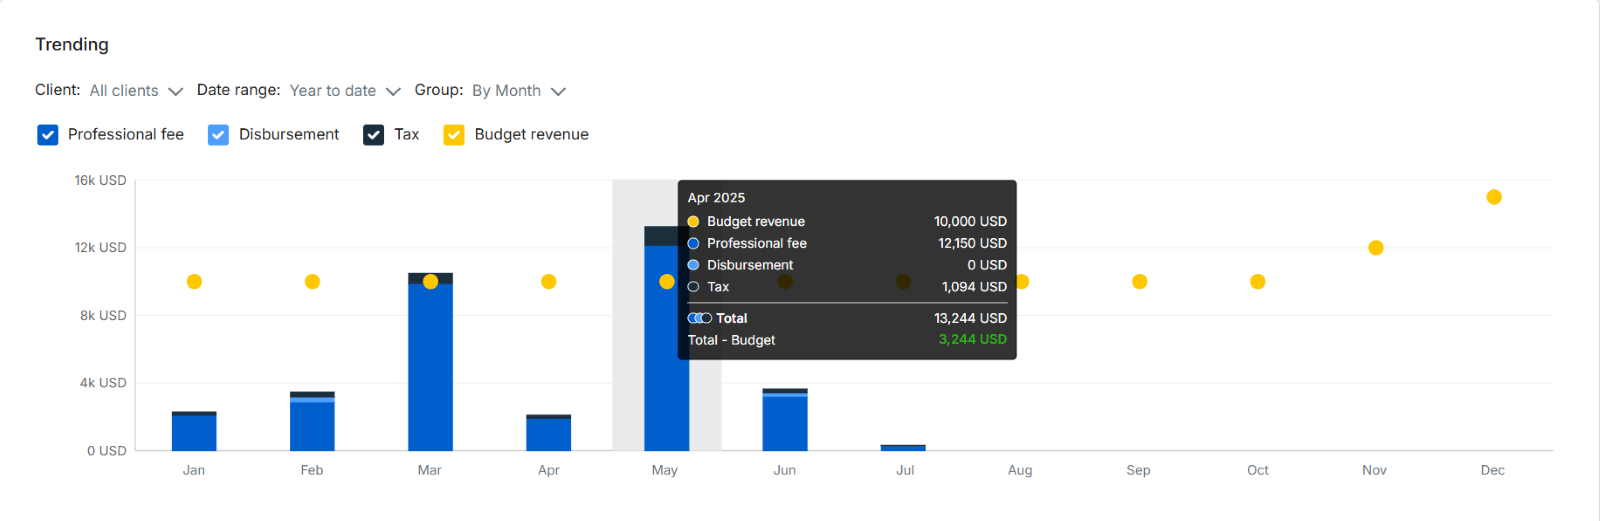
The Trending Chart shows total revenue over a period with color-coded columns for each revenue category. You can:
- Hover over a column to view a tooltip with totals, single revenue category amounts, and budgeted revenue details (if configured by your firm).
- Enable or disable specific revenue categories to focus on your preferred view. For example, disable disbursements and taxes to focus solely on professional fees.
- Click multiple columns to view revenue data across different periods. Click again to deselect.
Revenue categories:
- Professional Fee : Reflects service-related charges.
- Disbursement : Accounts for additional expenses or costs.
- Tax : Displays applicable tax amounts.
- Budget Revenue : Indicates planned revenue for comparison purposes.
Report details
The report details table provides detailed revenue data for a specific date. To access it:
- Click a column in the Trending Chart to view the corresponding details.
- The table will display automatically.
The table includes the following columns:
Tips:
- Click a client’s name to expand and view the specific matters associated with their billing.
- To view the billing statement columns, please click on “View setting” and enable it.
Customizing the reports
Customize the trending chart or report details with these options:
- Date range: Defaults to Year-to-Date. Adjust to analyze different periods.
- Grouping: Organize data by month (default), quarter, or year.
- Clients: Narrow data by all clients (default), specific clients, teams, or users.
Export reports
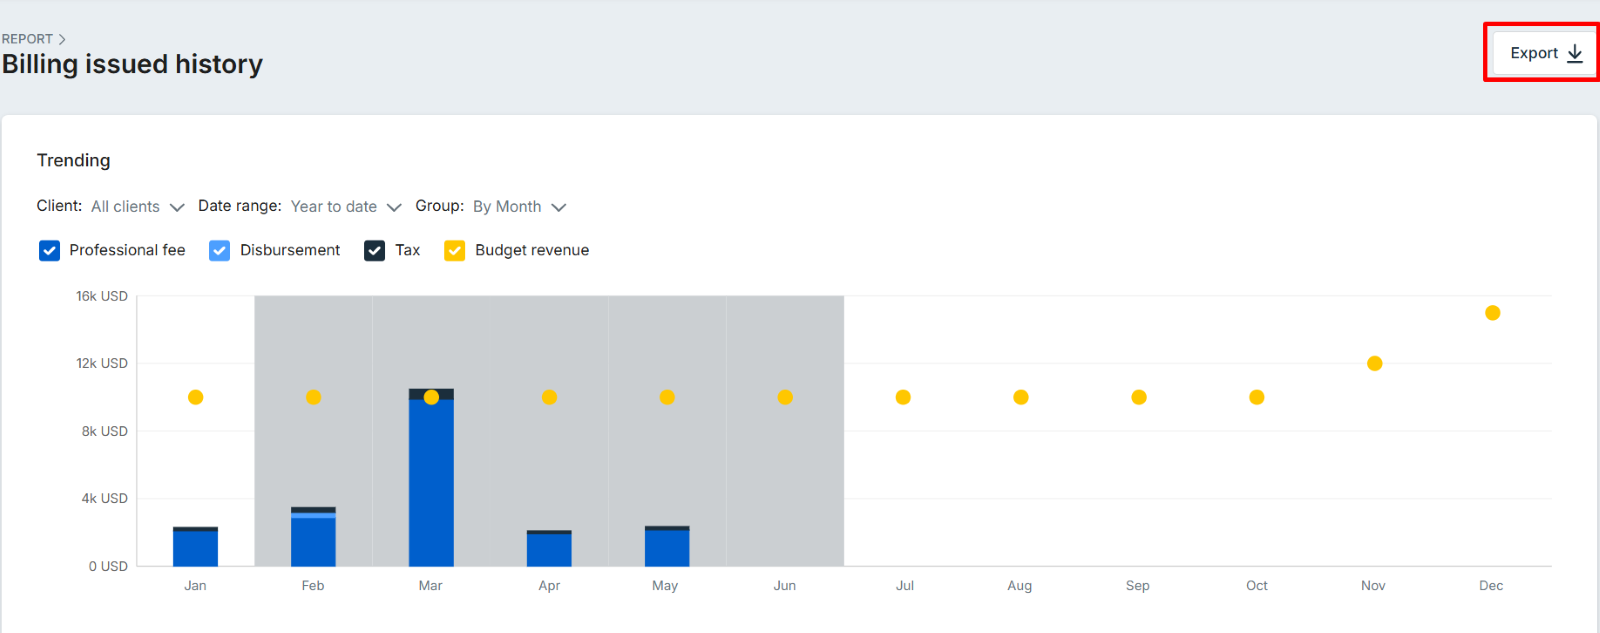
The billing issued history report can be exported to Excel (XLSX). To exports:
- Narrow the data by selecting a time period, client, team, or user in the Filters menu.
- Click the Export button on the right side of the report.
- In the pop-up window, confirm or adjust filters (e.g., date range, clients, teams, or users).
- Click Export to download the data.
For further assistance, visit the bilabl Help Center or email support@bilabl.io.