Time tracking by user
In this article
The time tracking by user report in bilabl provides a clear overview of how users and teams utilize their time. This report allows you to monitor whether users have logged sufficient hours for the day, week, or month. The data can be used to support actions such as payroll processing or performance evaluations.
Before you begin:
- Access permissions: Your ability to view report data depends on your user role:
- Admin, Manager, Accountant: Full access to data for all users.
- Team leader: Access limited to your team members’ data.
- User: Access is restricted to your own data only.
- Target work hours: Set in each user’s profile. Contact your HR, manager, or administrator to adjust these settings. For more details, see the Add New User guide.
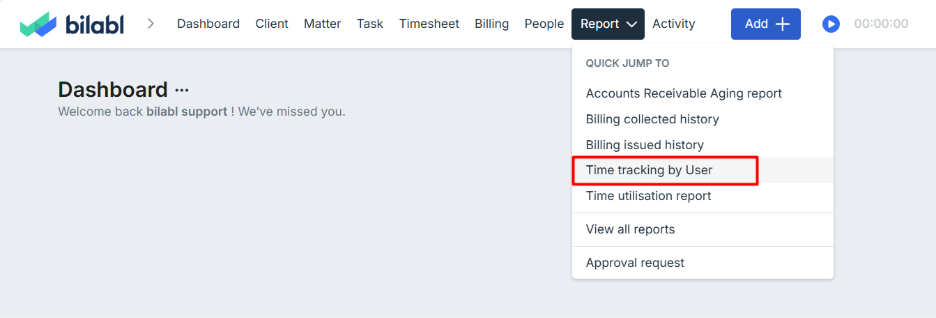
Accessing the report
To view the time tracking by user the report, follow these steps:
- Navigate to the reports section.
- Locate and select the time tracking by user report.
Understanding report sections
Report summary
The report summary visualizes time utilization for the selected period, comparing logged time against target work hours. Only users with appropriate permissions (e.g., Admin, Manager, Team Leader) can view this data for multiple users or teams.
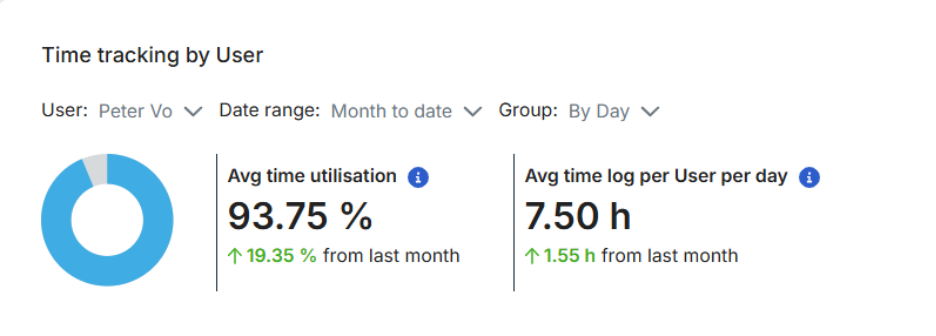
Avg time utilization
This metric shows the percentage of logged time compared to target work hours for a user or team in the selected period, with a comparison to the same period in the past (e.g., week, month, year) to highlight changes in efficiency.
1. Formula: (Total Logged Hours) / (Total Target Work Hours)
- Total logged hours: Sum of hours logged by the user(s) in the selected period, excluding non-workdays (e.g., weekends).
- Total target work hours: Sum of target hours for the user(s) in the selected period, excluding non-workdays.
- Team/tenant level: Utilization = (Sum of individual logged hours) / (Sum of individual target hours).
2. Examples:
- User A (Mon–Thu): Logged (8+8+8+5) = 29 hours; Target (8+8+8+8) = 32 hours; Utilization = 29/32 = 90.63%.
- User A (week): Logged (8+8+8+5+0+0+0) = 29 hours; Target (8+8+8+8+8+0+0) = 40 hours; Utilization = 29/40 = 72.50%.
- User B (week): Logged (4+2+2+4+4+4+0) = 20 hours; Target (4+4+4+4+4+0+0) = 20 hours; Utilization = 20/20 = 100.00%.
- User C (week): Logged (9+0+5+0+4+0+0) = 18 hours; Target (8+0+8+0+8+0+0) = 24 hours; Utilization = 18/24 = 75.00%.
- Team (user A + B + C, week): Logged (29+20+18) = 67 hours; Target (40+20+24) = 84 hours; Utilization = 67/84 = 79.76%. Team utilization reflects weighted average of individual rates.
Average time logged per user per day
The average number of hours logged by the user(s) each day.
- Formula: Total logged time / workdays
- Example: User Peter Vo logged 7.50 hours daily in July, up 1.55 hours from the same period last month (5.95 hours).
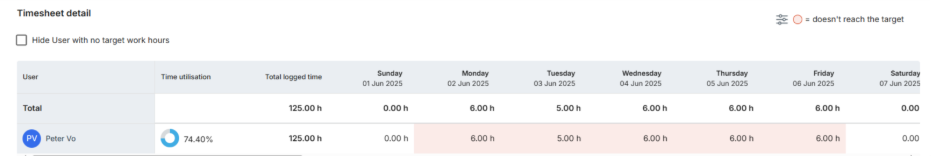
Report details
The table displays time tracking data for the selected period by default, based on the filters applied (e.g., date range, user, team). It includes:
Customizing the reports
Customize the trending chart or report details with these options:
- Date range: Defaults Year-to-Date. Adjust to analyze different periods.
- Grouping: Organize data by month (default), quarter, or year.
- User: Narrow data for all users, specific users, teams, or multiple users.
- Hide users with no target work hours: If you check this box, user without set target hours won’t appear in the report. This changes the percentage in Average Time Utilization by removing their logged hours from the total logged hours.
- Example: A team logs 67 hours with a target of 84 hours, so the utilization is 67÷84 = 79.76%. If a member with no target hours logged 10 of those hours, checking this box removes their 10 hours. Now the team has 57 logged hours and 84 target hours, so the utilization is 57÷84 = 67.86%.
- Additional columns: Add columns like Team, Position, or User Role in View Settings.
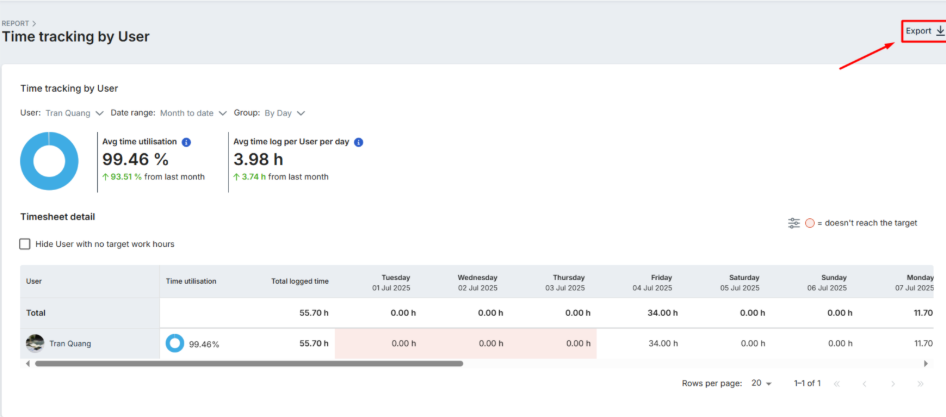
Export reports
The time tracking by user report can be exported to Excel (XLSX). To exports:
- Narrow the data by selecting a time period, user, date range, and group in the Filters menu.
- Click the Export button on the right side of the report.
- In the pop-up window, confirm or adjust filters (e.g., date range, user, group).
- Click Export to download the data.