Billing collected history report
In this article
The billing collected history report in bilabl provides a detailed overview of all payments collected from clients over a specific period. This report helps you track revenue, compare it with budgeted revenue, and evaluate individual or team performance.
Before you begin:
Revenue visibility: Each user can access the collected revenue data based on their user role:
- Admin, Manager, Accountant: Full access to revenue data for all clients.
- Team Leader: Limited revenue data for clients assigned to your team.
- User: Restricted revenue data for your assigned clients.
Accessing the report
You can view the billing collected history reports in two ways: a detailed report or a summary widget on your dashboard.
Detailed report
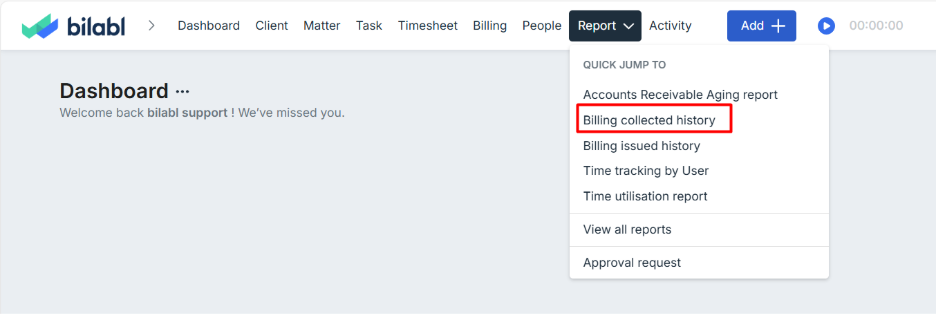
To view the detailed report, follow these steps:
- Navigate to the Reports section.
- Locate and select the Billing collected history report.
Report widget (summary view)
To display the report on your dashboard:
- Follow the instructions in Manage Your Widgets to enable the billing collected history widget.
- Once added, the summary will appear directly on your dashboard.
Understanding report sections
Trending chart
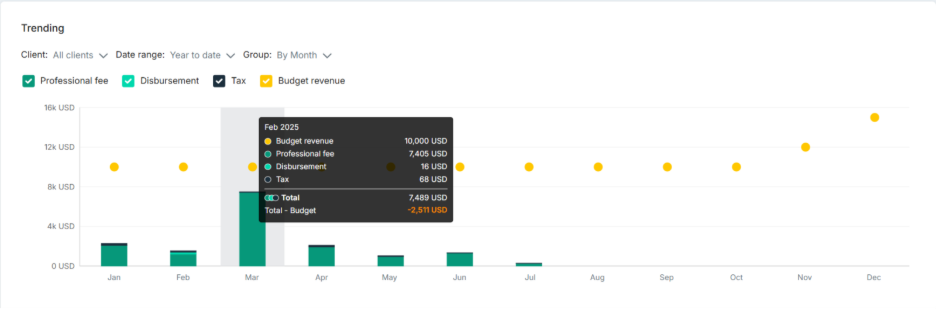
The trending chart displays total payments over time with the colored columns for each revenue category. You can:
- Hover over a column to view a tooltip with totals, single revenue category amounts, and budgeted revenue details (if configured by your firm).
- Enable or disable specific revenue categories (e.g., professional fees, disbursements, taxes) to focus on your preferred view.
- Select multiple columns to compare revenue data across different periods; click again to deselect.
Revenue categories:
- Professional Fee: Reflects the service-related revenue that has been paid.
- Disbursement: Costs or expenses paid on behalf of clients, such as court fees or travel expenses, that have been reimbursed.
- Tax: Collected tax amounts associated with the professional fee or disbursements.
- Budget revenue: The revenue goal set by your firm’s administrators for a specific period, used to compare actual payments against planned financial targets
Report details
The report details table provides detailed revenue data that has been collected for a specific time period. To access it, click a column in the trending chart to view the corresponding details and the table will display automatically.
The table includes the following columns:
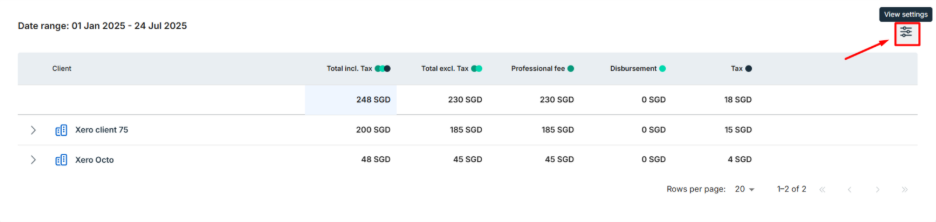
Configuring the Report View
- Click a client’s name to view specific matters, including billing, issued date, due date, and payment details.
- Click the "View Settings" button in the top-right corner to select additional columns (e.g., billing statement, issued date, due date, payment) from the dropdown menu.
Customizing the reports
Customize the trending chart or report details with these options:
- Date range: Defaults to Year-to-Date. Adjust to analyze different periods.
- Grouping: Organize data by month (default), quarter, or year.
- Clients: Narrow data for all clients (default), specific clients, teams, or users.
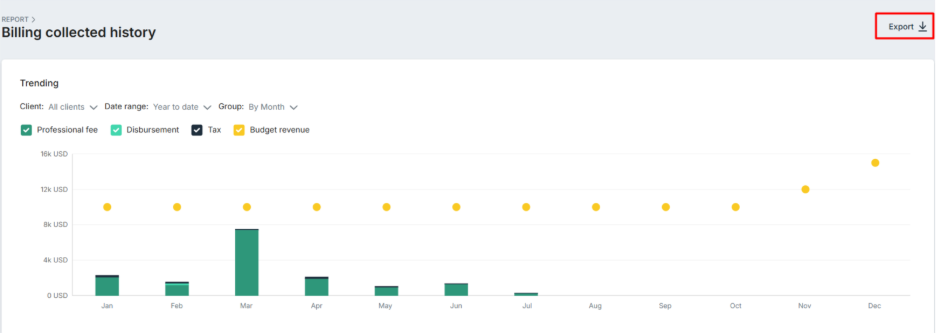
Export reports
The billing collected history report can be exported to Excel (XLSX). To exports:
- Narrow the data by selecting a time period, client, team, or user in the Filters menu.
- Click the Export button on the right side of the report.
- In the pop-up window, confirm or adjust filters (e.g., date range, clients, teams, or users).
- Click Export to download the data.