Account Receivable Aging Report
In this article
The Accounts Receivable Aging Report is designed to help your business track and manage overdue customer payments efficiently. This report organizes outstanding or partially paid invoices into time-based categories, highlighting how long payments have been overdue. By providing clear insights into payment trends, it enables you to accelerate collections, prioritize follow-ups, and optimize cash flow.
Access to the Accounts Receivable Aging Report varies based on your user role. Default permissions are as follows:
- Admin, Manager, Accountant: Full access to data for all clients.
- Team Leader: Limited to data for clients assigned to your team.
- User: Restricted to your own client data.
Tip: Contact your system administrator if you need to adjust your access level.
Accessing the report
You can view the Accounts Receivable Aging Report in two ways: a detailed report or a summary widget on your dashboard.
Full detailed report
To access the full detailed version of the report, follow these steps:
- Navigate to the Reports section.
- Locate and select the Accounts Receivable Aging report.

Dashboard widget (summary view)
To access the general version of the report, follow these steps:
- On your dashboard, click on More Options.

- In the Manage Widget window, navigate to the Accounts Receivable Aging report.
- Enable the report and click Save to apply the changes.

Once added, the report will be accessible directly from your dashboard.
Tip: Drag and drop widgets to customize your dashboard layout for quick access.
Understanding report sections
The report is divided into key sections to help you analyze overdue payments and identify trends.
Trending chart
The Trending chart provides a visual overview of payment trends using color-coded columns. Each column represents an aging category, making it easy to spot overdue payments at a glance.
Color-coded categories: Payments are grouped into six categories to help you identify overdue statuses:
- Due (Green): not yet overdue.
- Past Due 1-14 Days (Yellow): slightly overdue.
- Past Due 15-30 Days (Orange): moderately overdue.
- Past Due 31-60 Days (Red): high risk.
- Past Due 61-90 Days (Purple): critical risk.
- 90+ Days Late (Black): Urgent action needed.
Tooltip: Hover over any column in the Trending Chart to view a tooltip with a detailed breakdown of payment amounts and percentages for each aging category. For example, a high percentage in the "Past Due >90 Days" category signals the need for immediate follow-up.
Report details
A table providing detailed payment data for a specific date. To access it, click a column in the Trending Chart to view the corresponding details.
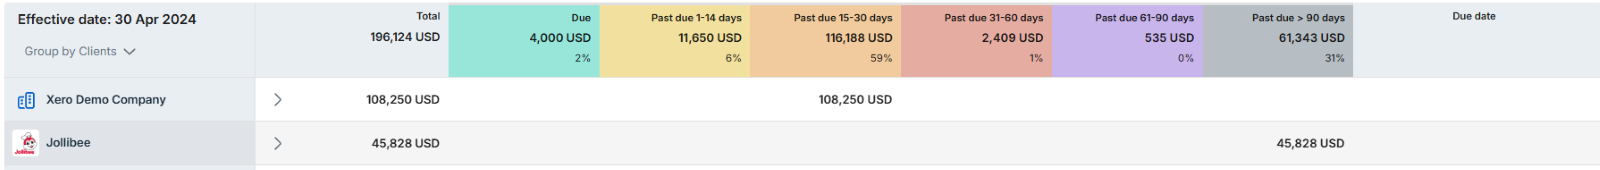
Total amount and percentage:
At the top of the table, you’ll see the total for each aging category, aligned with the color-coded segments. Categories include:
- Total: the total amount of all outstanding billings
- Due: amounts not yet overdue
- Past due 1-14 days
- Past due 15-30 days
- Past due 31-60 days
- Past due 61-90 days
- Past due >90 days
Billing statements
To view detailed billing information:
- Click the dropdown next to a client’s name.
- Select the billing ID you want to review.
Customizing report
Tailor the report to meet your business needs with the following options:
Aging date range
The report enables you to tailor the aging date range to suit your firm’s specific requirements. To modify the aging date range:
- Click the Config button.
- Adjust the date range for each category as needed.
- Save your changes to apply them to the report.

Report views in trending chart
Customize the data in the trending chart with these options:
- Time Period: Defaults to Year-to-Date. Adjust the timeframe to analyze different periods.
- Grouping: Organize data by month (default), quarter, or year.
- Filters: Narrow data by clients, teams, or users. By default, all client data is displayed.
Group by option in detailed reports
For focused analysis in the detailed reports, group data by:
- Specific Clients: View payment statuses for individual clients (e.g., Xero Demo Company).
- Account Manager: Group by the account manager responsible for clients.
- No Grouping: Display all billings without segmentation.
View setting configuration in detailed reports
To customize displayed data in the detailed reports, you can follow the steps below:
- Click View Settings.
- Enable the Due Date option to include due dates for each billing, helping you manage payment timelines.
Best Practices
- Prioritize urgent collections: Focus on the "Past Due >90 Days" (black) category to address critical overdue payments first.
- Export for analysis: Use the Export button to download the report as an Excel file for deeper insights.
- Review regularly: Check the report weekly to stay ahead of cash flow issues.
- Keep data updated: Ensure all billings are promptly recorded in your system for accurate reporting.
Note: Inaccurate or outdated billing data may affect the report’s reliability. Verify your records regularly.
For further assistance, visit the bilabl Help Center or email support@bilabl.io.